Refactoring AI-Generated Code for Better Performance
AI code generators produce working code in seconds, but that code often carries redundant loops, bloated dependencies, and naive algorithm choices that tank performance under real load. The gap between code that runs and code that runs well is exactly where refactoring lives. This guide walks through the specific performance problems AI-generated code introduces, the strategies that fix them, and a concrete before-and-after example you can apply to your own projects today.

AI code generators produce working code in seconds, but that code often carries redundant loops, bloated dependencies, and naive algorithm choices that tank performance under real load. The gap between code that runs and code that runs well is exactly where refactoring lives. This guide walks through the specific performance problems AI-generated code introduces, the strategies that fix them, and a concrete before-and-after example you can apply to your own projects today.
TL;DR:- AI-generated code frequently contains redundant computations, unnecessary allocations, and O(n²) patterns that collapse under production traffic.
- Refactoring targets three layers: algorithm complexity, module structure, and dependency footprint.
- Profiling first, then refactoring, prevents wasted effort on code paths that don't matter.
Why AI-Generated Code Needs Refactoring
Code from Copilot, Claude, or ChatGPT compiles. It passes basic tests. Then it hits 10,000 concurrent users and response times spike from 40ms to 4 seconds. The reason is straightforward: LLMs optimize for correctness and readability in isolation, not for runtime performance in your specific architecture.
A typical AI-generated function solves the problem it was asked to solve. It does not consider that the same data structure gets iterated three times in the calling code, that the ORM query inside a loop triggers N+1 selects, or that the imported utility library adds 200KB to your bundle for one helper function. These are not bugs. They are performance liabilities that compound as your codebase grows.
Refactoring AI output is not about distrust. It is about applying the same engineering discipline you would apply to any code entering your production system. The difference is volume: AI generates code faster than humans, so the refactoring backlog grows faster too.
Common Performance Issues
Here are the patterns that show up repeatedly when profiling AI-generated code across Python, TypeScript, and Java projects:
- Redundant iterations - The AI creates separate
.filter(),.map(), and.reduce()calls where a single pass would do. Each pass allocates a new array. - N+1 database queries - ORM code inside loops. The AI writes a
for user in users: user.orderspattern instead of a joined or eager-loaded query. - Oversized dependencies - Importing
lodashfor_.get()ormomentfor a single date format. The AI picks the library it saw most in training data, not the lightest option. - Unnecessary object copies - Deep cloning entire state trees when only one field changes. Common in React/Redux code generated by AI.
- Synchronous blocking - File reads, HTTP calls, or crypto operations done synchronously in Node.js or Python async contexts.
- Unindexed lookups - Linear searches through arrays when a
Map,Set, or database index would drop lookup time from O(n) to O(1). - String concatenation in loops - Building strings with
+=inside tight loops instead of usingStringBuilder,join(), or template buffers.
Fixing N+1 queries alone typically cuts API response times by 50-80% in data-heavy endpoints. That single pattern is worth checking first in every AI-generated backend module.
Modularization Cuts Complexity

AI tends to generate monolithic functions. You ask for "a function that processes user orders" and get a 120-line method that validates input, queries the database, calculates totals, applies discounts, sends emails, and logs analytics. All in one function.
Modularization breaks that into focused units:
validateOrderInput(order)- pure function, easy to unit testfetchOrderData(orderId)- single DB call, cacheablecalculateTotal(items, discounts)- pure math, no side effectssendConfirmation(order, user)- isolated I/O
calculateTotal is slow, you know exactly where to look. When the email service times out, it does not block the total calculation.
Smaller modules also enable lazy loading. In frontend code, splitting a 400KB AI-generated utility file into focused modules lets your bundler tree-shake unused exports and code-split routes. Bundle size drops. Time-to-interactive improves.
| Monolithic AI Output | Modularized Refactor |
|---|---|
| 120-line single function | 4-6 focused functions, 15-30 lines each |
| Hard to profile | Profile each module independently |
| Full bundle loaded upfront | Tree-shakeable, code-splittable |
| One test covers everything (poorly) | Targeted unit tests per module |
| Side effects mixed with logic | Pure functions separated from I/O |
Optimize Algorithms, Not Just Style
The biggest performance wins come from algorithmic changes, not cosmetic ones. Renaming variables and adding comments does not make code faster. Replacing an O(n²) nested loop with a hash map lookup does.
Here is a concrete example. AI-generated code to find duplicate entries in a list:
# AI-generated: O(n²) approach
def find_duplicates(items):
    duplicates = []
    for i in range(len(items)):
        for j in range(i + 1, len(items)):
            if items[i] == items[j] and items[i] not in duplicates:
                duplicates.append(items[i])
    return duplicates
Refactored version using a set for O(n) performance:
# Refactored: O(n) approach
def find_duplicates(items):
    seen = set()
    duplicates = set()
    for item in items:
        if item in seen:
            duplicates.add(item)
        else:
            seen.add(item)
    return list(duplicates)
With 10,000 items, the first version runs roughly 50 million comparisons. The second runs 10,000. That is not a micro-optimization. That is the difference between a 200ms endpoint and a 2ms endpoint.
"See how Blue Pearl transformed a legacy codebase, eliminated security risks and accelerated modernization with Bob, cutting delivery time by nearly 90%.">, What Is AI Code Refactoring?
Tools That Accelerate Refactoring

You do not need to eyeball every line. These tools catch the patterns described above automatically:
- ESLint / Biome (JavaScript/TypeScript) - Flag unused imports, redundant conditions, and complexity thresholds. Custom rules can catch AI-specific patterns like unnecessary
awaitin non-async contexts. - Pylint + Bandit (Python) - Pylint catches complexity and style issues. Bandit flags security-relevant performance problems like insecure random number generation in loops.
- SonarQube / SonarCloud - Cross-language static analysis. Its "cognitive complexity" metric is particularly useful for AI-generated code that nests conditions deeply.
- py-spy / cProfile (Python) and Chrome DevTools Profiler (JS) - Runtime profilers that show exactly where time is spent. Profile before refactoring.
- Webpack Bundle Analyzer / Vite's rollup-plugin-visualizer - Visualize dependency bloat. See which AI-imported packages dominate your bundle.
- JetBrains IDE refactoring tools - Extract Method, Inline Variable, Change Signature. Mechanical refactoring that the IDE handles safely.
The Refactoring Process Step by Step
This diagram shows the workflow from raw AI output to production-ready code:
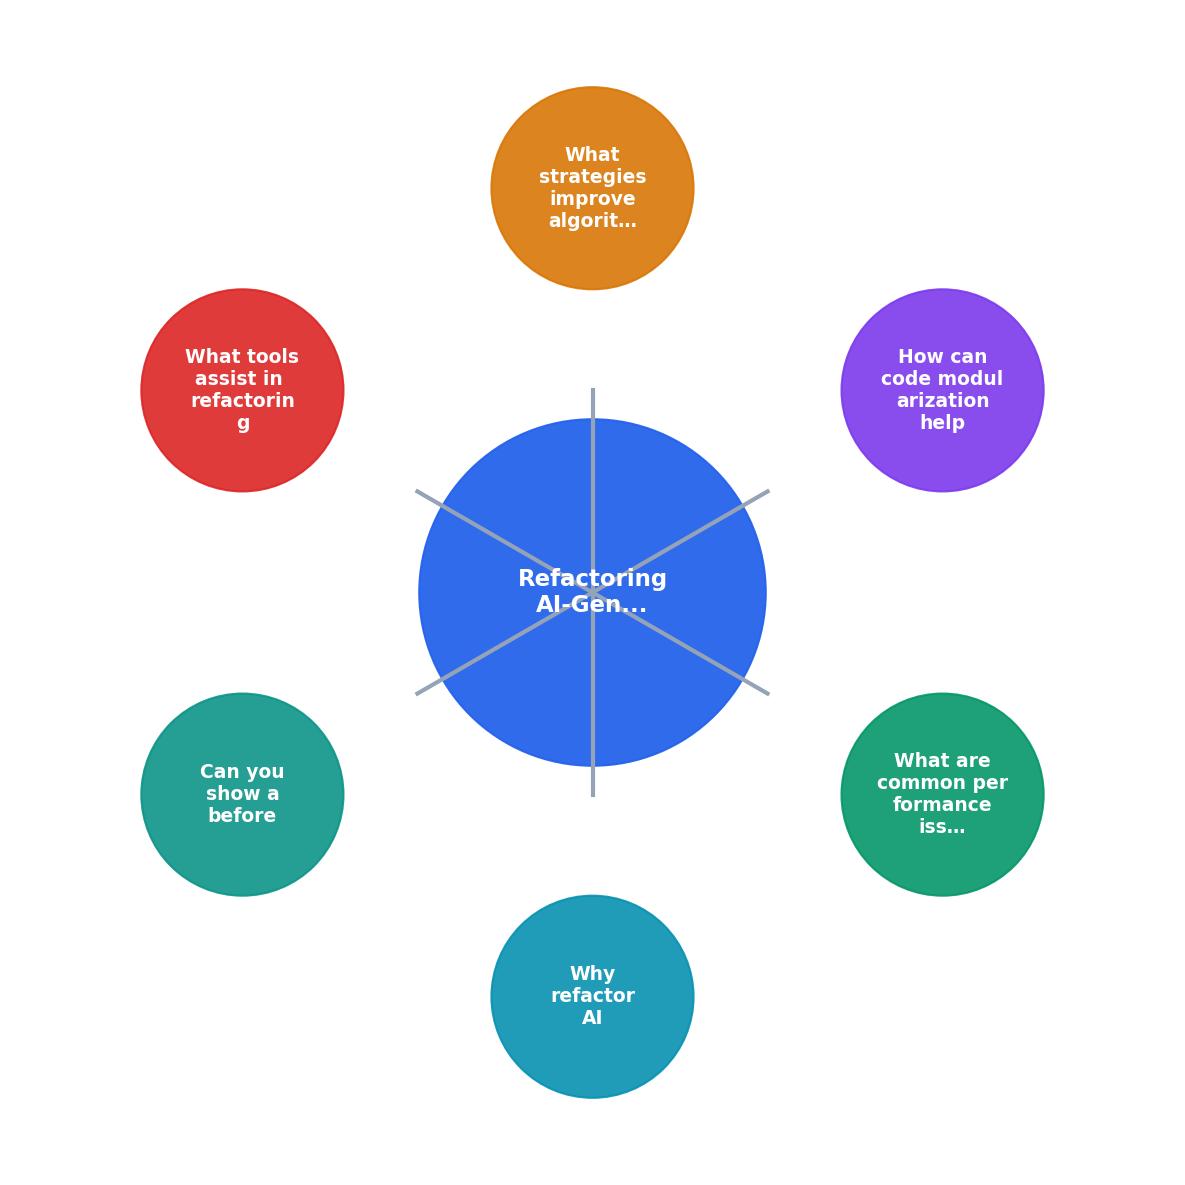
The steps in the diagram break down as follows:
- Profile - Run the profiler. Identify the top 3 hotspots by execution time or memory allocation.
- Add tests - Write tests covering the current behavior of each hotspot function. Use the existing output as your expected values.
- Extract modules - Break monolithic functions into focused units. One responsibility per function.
- Optimize algorithms - Replace naive patterns (nested loops, linear searches, repeated allocations) with efficient alternatives.
- Trim dependencies - Replace heavy libraries with lighter alternatives or native APIs. Remove unused imports.
- Validate - Run your test suite. Compare profiler output before and after. Confirm the performance gain is real.
Typical Performance Gains by Refactoring Step
Note that "Profile" itself does not speed up code, but it directs your effort so you avoid wasting time on cold paths. The 15% represents the efficiency gain from targeted work versus blind refactoring.
Before-and-After: Express.js Endpoint
Here is a real-world pattern from an AI-generated Node.js API endpoint that fetches user dashboards:
// AI-generated: multiple awaits in sequence, full lodash import
const _ = require('lodash');

app.get('/dashboard/:userId', async (req, res) => {
  const user = await db.query('SELECT  FROM users WHERE id = $1', [req.params.userId]);
  const orders = await db.query('SELECT  FROM orders WHERE user_id = $1', [req.params.userId]);
  const notifications = await db.query('SELECT  FROM notifications WHERE user_id = $1', [req.params.userId]);

const recentOrders = _.filter(orders.rows, o => {
    return _.now() - new Date(o.created_at).getTime() < 86400000;
  });

const summary = _.map(recentOrders, o => _.pick(o, ['id', 'total', 'status']));

res.json({ user: user.rows[0], orders: summary, notifications: notifications.rows });
});
Refactored version:
// Refactored: parallel queries, no lodash, single-pass filter+map
const DAY_MS = 86_400_000;

app.get('/dashboard/:userId', async (req, res) => {
  const userId = req.params.userId;

const [user, orders, notifications] = await Promise.all([
    db.query('SELECT id, name, email FROM users WHERE id = $1', [userId]),
    db.query(
      'SELECT id, total, status FROM orders WHERE user_id = $1 AND created_at > NOW() - INTERVAL \'1 day\'',
      [userId]
    ),
    db.query('SELECT id, message, read FROM notifications WHERE user_id = $1 ORDER BY created_at DESC LIMIT 20', [userId]),
  ]);

res.json({
    user: user.rows[0],
    orders: orders.rows,
    notifications: notifications.rows,
  });
});
- Sequential queries became parallel with
Promise.all(). Three 50ms queries now take 50ms total instead of 150ms. - Date filtering moved to SQL where the database index handles it, instead of fetching all orders and filtering in JavaScript.
- Column selection moved to SQL (
SELECT id, total, statusinstead ofSELECT), reducing data transfer. - Lodash removed entirely. Native array methods and SQL handle everything.
- Notification query got a LIMIT to prevent unbounded result sets.
AI Code Refactoring Checklist
Your progress is saved automatically in your browser.
For a deeper dive into refactoring strategies and AI-assisted development workflows, the Vibe Coding Bible at vibecodingbible.org covers these patterns across full project lifecycles.
FAQ
Frequently Asked Questions
SELECT * queries inside loops, and imports of large utility libraries used for a single function. If your profiler shows more than 30% of execution time in a single function, that function is a refactoring candidate.Additional Resources
- What Is AI Code Refactoring? - AI code refactoring employs artificial intelligence to automate the process of refactoring code. It uses machine learning and natural ...
- AI code refactoring: Strategic approaches to enterprise ... - Refactored code may look cleaner and more efficient while introducing subtle behavioral changes that only emerge under specific conditions.
- AI Code Refactoring: Tools, Tactics & Best Practices - This guide demonstrates systematic AI-assisted refactoring using semantic dependency analysis, atomic transformations, and automated quality ...
Ready to Master Vibe Coding?
Learn to build software faster with AI assistance using the Vibe Coding Bible.
Get Started